

This multi-part blog post focuses on monitoring a Microsoft Windows EC2 instances running on AWS. The AWS’s native tool for monitoring and observability is Cloudwatch so we will using it in this blog series.
AWS Cloudwatch allows you to monitor and alert on the following elements:
- Server performance metrics (eg cpu, memory and disk statistics)
- Windows service status (eg windows sploor)
- Windows event logs (eg application log entries)
- Windows file logs (eg iis logs)
Cloudwatch includes two areas of data collection
- Metrics
- Logs
Under metrics, we gather server performance data and some windows process data (or service data in Windows terminology). The Cloudwatch logs capability can sync Windows Event logs (eg system, security & application event logs) entries and generic files logs such as IIS logs into Cloudwatch log group. The first part of this blog provides an overview of Cloudwatch Windows data collection. Part 2 will focus on metric & log collection in more detail.
The same infrastructure will be used for both parts of the blog series and can be found in GitHub repository here.

You may have noticed that the code used in the ‘Checkov Security Linting’ blog has been extended and used in this blog series and hopefully some aspects of the code are familiar. ******* Note, It is possible to only deploy the VPC infrastructure to a single Availability Zone (AZ) to save costs.
Why do we need so many components for monitoring/alerting? Some of the components such as KMS keys are required to meet some best practice principles ie encrypt data at rest (on the EC2 instance and log groups). The SNS topic allows users to subscribe to Cloudwatch alarm alerts. Parameter store is used to store the Cloudwatch monitoring configuration centrally so that it can be reused on other application servers in the same solution.
Monitoring is setup using the Cloudwatch configuration file in the GitHub repository. The majority of the configuration is done using EC2 userdata where the Cloudwatch agent is downloaded from the internet and configured using the configuration settings stored in the SSM parameter store. This all happens during the EC2 initial boot up. The overall agent configuration and how alerts sent to a SNS topic is shown below.
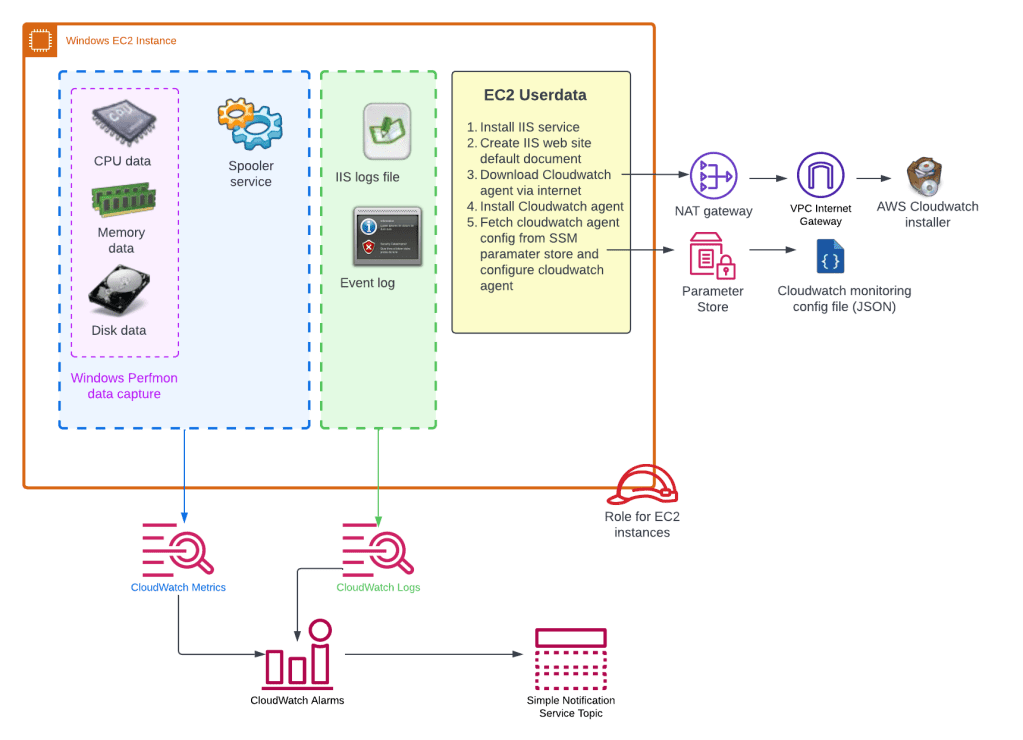
It is possible to gather/see metrics from a hypervisor perspective without using the Cloudwatch agent. Typical Windows server admins like to use resource monitor as their initial investigations when users complain about poor application performance. From resource manager server admins we can inspect CPU utilisation, memory utilisation and free disk space. Some of these metrics are not available via the hypervisor so we need to get the operating systems to supply this data via Cloudwatch agent. For Windows Server, these metrics are retrievable using Performance Monitor (aka Perfmon) and is the purple dotted box in the diagram above. To configure the Cloudwatch agent to gather OS data we tell it which Perfmon counters to monitor. The extract from the cloudwatch config file shows the perfmon counter names in red boxes below.

Note, there is no Perfmon counter for Memory utilisation. So we need to do a bit of a calculation to work this out using the “Available Mbytes” eg a Windows server admin may want to generate an alert if the utilisation is greater than 80%. This is the same as generating an alert when the utilisation is less than 20%.
A summary of the files in Github repository
app_cw_agent_config.json – cloudwatch config file of metrics to send to cloudwatch
{
        "logs": {
                "logs_collected": {
                        "files": {
                                "collect_list": [
                                        {
                                                "file_path": "C:\\inetpub\\logs\\LogFiles\\W3SVC1\\*.log",
                                                "log_group_name": "/demo-monitoring-iis-logs",
                                                "log_stream_name": "{instance_id}",
                                                "retention_in_days": 3
                                        }
                                ]
                        },
                        "windows_events": {
                                "collect_list": [
                                        {
                                                "event_format": "text",
                                                "event_levels": [
                                                        "VERBOSE",
                                                        "INFORMATION",
                                                        "WARNING",
                                                        "ERROR",
                                                        "CRITICAL"
                                                ],
                                                "event_name": "application",
                                                "log_group_name": "/demo-monitoring-application-logs",
                                                "log_stream_name": "{instance_id}",
                                                "retention_in_days": 7
                                        }
                                ]
                        }
                }
        },

        "metrics": {
                "namespace": "demo-monitoring",
                "aggregation_dimensions": [
                        [
                                "InstanceId"
                        ]
                ],
                "append_dimensions": {
                        "InstanceId": "${aws:InstanceId}"
                },
                "metrics_collected": {
                        "LogicalDisk": {
                                "measurement": [
                                        "% Free Space"
                                ],
                                "metrics_collection_interval": 60,
                                "resources": [
                                        "*"
                                ]
                        },
                        "Memory": {
                                "measurement": [
                                        "Available Mbytes"
                                ],
                                "metrics_collection_interval": 60
                        },
                        "Processor": {
                                "measurement": [
                                        "% Processor Time"
                                ],
                                "metrics_collection_interval": 60,
                                "resources": [
                                        "_Total"
                                ]
                        },
                        "procstat" : [
                                {
                                        "exe" : "spoolsv",
                                        "measurement" : [
                                                "memory_rss",
                                                "memory_vms",
                                                "cpu_time_system",
                                                "cpu_time_user"
                                        ]
                                }

                        ]
                }
        }
}
cloudwatch.tf – cloudwatch alarms, log group configuration and log group filter configuration
#------------------------------------------------------------------------------
# EC2 alarms
#------------------------------------------------------------------------------


resource "aws_cloudwatch_metric_alarm" "demo_monitoring_os_cpu_utilization" {
  count = (var.demo_monitoring_cpu_utilization_threshold > 0 && var.demo_monitoring_enabled) ? 1 : 0

  alarm_name          = "${var.app_name}-ec2-cpu-utilization"
  alarm_description   = "Average CPU utilization alarm activated when CPU utilisation over threshold."
  namespace           = var.demo_monitoring_namespace
  metric_name         = "Processor % Processor Time"
  statistic           = "Average"
  datapoints_to_alarm = 3
  period              = 60
  evaluation_periods  = 3
  comparison_operator = "GreaterThanThreshold"
  threshold           = var.demo_monitoring_cpu_utilization_threshold
  alarm_actions       = [module.demo_monitoring_sns_topic.sns_topic_arn]
  ok_actions          = [module.demo_monitoring_sns_topic.sns_topic_arn]
  dimensions = {
    InstanceId = module.demo_monitoring_server01.id
    instance   = "_Total"
    objectname = "Processor"
  }
  treat_missing_data = "breaching"

  tags = merge(local.tags_generic)
}

resource "aws_cloudwatch_metric_alarm" "demo_monitoring_os_mem_free" {
  count = (var.demo_monitoring_memory_available_Mbytes_threshold > 0 && var.demo_monitoring_enabled) ? 1 : 0

  alarm_name          = "${var.app_name}-ec2-memory-free"
  alarm_description   = "Average Memory free (MBytes) alarm activated when memory is less the threshold."
  namespace           = var.demo_monitoring_namespace
  metric_name         = "Memory Available Mbytes"
  statistic           = "Average"
  datapoints_to_alarm = 3
  period              = 60
  evaluation_periods  = 3
  comparison_operator = "LessThanThreshold"
  threshold           = var.demo_monitoring_memory_available_Mbytes_threshold
  alarm_actions       = [module.demo_monitoring_sns_topic.sns_topic_arn]
  ok_actions          = [module.demo_monitoring_sns_topic.sns_topic_arn]
  dimensions = {
    InstanceId = module.demo_monitoring_server01.id
  }
  treat_missing_data = "breaching"

  tags = merge(local.tags_generic)
}

resource "aws_cloudwatch_metric_alarm" "demo_monitoring_os_logicaldrive_c_percent_freespace" {
  count = (var.demo_monitoring_disk_free_threshold > 0 && var.demo_monitoring_enabled) ? 1 : 0

  alarm_name          = "${var.app_name}-ec2-drive-free-space-c"
  alarm_description   = "Free disk space alarm is activated when disk space is less than threshold (percentage)."
  namespace           = var.demo_monitoring_namespace
  metric_name         = "LogicalDisk % Free Space"
  statistic           = "Average"
  datapoints_to_alarm = 3
  period              = 60
  evaluation_periods  = 3
  comparison_operator = "LessThanOrEqualToThreshold"
  threshold           = var.demo_monitoring_disk_free_threshold
  alarm_actions       = [module.demo_monitoring_sns_topic.sns_topic_arn]
  ok_actions          = [module.demo_monitoring_sns_topic.sns_topic_arn]
  dimensions = {
    InstanceId = module.demo_monitoring_server01.id
    instance   = "C:"
    objectname = "LogicalDisk"
  }
  treat_missing_data = "breaching"

  tags = merge(local.tags_generic)
}


resource "aws_cloudwatch_metric_alarm" "demo_monitoring_os_logicaldrive_d_percent_freespace" {
  count = (var.demo_monitoring_disk_free_threshold > 0 && var.demo_monitoring_enabled) ? 1 : 0

  alarm_name          = "${var.app_name}-ec2-drive-free-space-d"
  alarm_description   = "Free disk space alarm is activated when disk space is less than threshold (percentage)."
  namespace           = var.demo_monitoring_namespace
  metric_name         = "LogicalDisk % Free Space"
  statistic           = "Average"
  datapoints_to_alarm = 3
  period              = 60
  evaluation_periods  = 3
  comparison_operator = "LessThanOrEqualToThreshold"
  threshold           = var.demo_monitoring_disk_free_threshold
  alarm_actions       = [module.demo_monitoring_sns_topic.sns_topic_arn]
  ok_actions          = [module.demo_monitoring_sns_topic.sns_topic_arn]
  dimensions = {
    InstanceId = module.demo_monitoring_server01.id
    instance   = "D:"
    objectname = "LogicalDisk"
  }
  treat_missing_data = "breaching"

  tags = merge(local.tags_generic)
}


resource "aws_cloudwatch_metric_alarm" "demo_monitoring_os_spooler_service" {
  count = (var.demo_monitoring_service_sploorer_alarm_enabled && var.demo_monitoring_enabled) ? 1 : 0

  alarm_name          = "${var.app_name}-service-spooler"
  alarm_description   = "Spooler service"
  namespace           = var.demo_monitoring_namespace
  metric_name         = "procstat memory_rss"
  statistic           = "Minimum"
  datapoints_to_alarm = 2
  period              = 60
  evaluation_periods  = 3
  comparison_operator = "LessThanThreshold"
  threshold           = 123
  alarm_actions       = [module.demo_monitoring_sns_topic.sns_topic_arn]
  ok_actions          = [module.demo_monitoring_sns_topic.sns_topic_arn]
  dimensions = {
    InstanceId   = module.demo_monitoring_server01.id
    exe          = "spoolsv"
    process_name = "spoolsv.exe"
  }
  treat_missing_data = "breaching"

  tags = merge(local.tags_generic)
}


resource "aws_cloudwatch_metric_alarm" "demo_monitoring_windows_events_Error_demo" {
  count = (var.demo_monitoring_events_application_alarm_enabled && var.demo_monitoring_enabled) ? 1 : 0

  alarm_name          = "${var.app_name}-windows-events-appliation-log-error-demo"
  alarm_description   = "Alert on word demo with serverity Error in application log if found more the 3 times a minute"
  namespace           = var.demo_monitoring_namespace
  metric_name         = "ERROR-demo-occurances"
  statistic           = "Sum"
  datapoints_to_alarm = 1
  period              = 60
  evaluation_periods  = 1
  comparison_operator = "GreaterThanThreshold"
  threshold           = 2
  alarm_actions       = [module.demo_monitoring_sns_topic.sns_topic_arn]
  ok_actions          = [module.demo_monitoring_sns_topic.sns_topic_arn]
  treat_missing_data  = "notBreaching"

  tags = merge(local.tags_generic)
}

#------------------------------------------------------------------------------
# Log groups
#------------------------------------------------------------------------------

resource "aws_cloudwatch_log_group" "demo_monitoring_iis_logs" {
  name              = var.demo_monitoring_windows_iis_log_group
  retention_in_days = 3
  kms_key_id        = aws_kms_key.demo_monitoring_kms_key.arn

  tags = merge(local.tags_generic)
}

resource "aws_cloudwatch_log_group" "demo_monitoring_applicaiton_logs" {
  name              = var.demo_monitoring_windows_event_application_log_group
  retention_in_days = 7
  kms_key_id        = aws_kms_key.demo_monitoring_kms_key.arn

  tags = merge(local.tags_generic)
}

#------------------------------------------------------------------------------
# Log group filter
#------------------------------------------------------------------------------

resource "aws_cloudwatch_log_metric_filter" "demo_monitoring_applicaiton_filter" {
  name           = "demo-monitoring-applicaiton-filter"
  pattern        = " \"[ERROR]\" \"[567]\" demo"
  log_group_name = aws_cloudwatch_log_group.demo_monitoring_applicaiton_logs.name

  metric_transformation {
    name      = "ERROR-demo-occurances"
    namespace = var.app_name
    value     = "1"
  }
}
data.tf – used to get account ID for automation and build IAM policy documents using variables
data "aws_caller_identity" "current" {}

data "aws_iam_policy_document" "vpc_flow_logging_boundary_role_doc" {
  statement {
    sid    = "ServiceBoundaries"
    effect = "Allow"
    actions = [
      "logs:CreateLogGroup",
      "logs:CreateLogStream",
      "logs:PutLogEvents",
      "logs:DescribeLogStreams"
    ]
    resources = ["arn:aws:logs:${var.region}:${data.aws_caller_identity.current.account_id}:log-group:/aws/vpc-flow-log/${module.demo_monitoring_vpc.vpc_id}:*"]
  }
}

data "aws_iam_policy_document" "demo_monitoring_ec2_assumable_doc" {
  statement {
    sid    = "readssmparameter"
    effect = "Allow"
    actions = [
      "ssm:GetParameter"
    ]
    resources = [aws_ssm_parameter.cw_agent.arn]
  }


  statement {
    sid    = "test"
    effect = "Allow"
    actions = [
      "logs:CreateLogGroup",
      "logs:CreateLogStream",
      "logs:PutLogEvents",
      "logs:DescribeLogStreams"
    ]
    resources = ["arn:aws:logs:${var.region}:${data.aws_caller_identity.current.account_id}:${var.demo_monitoring_windows_event_application_log_group}:*",
    "arn:aws:logs:${var.region}:${data.aws_caller_identity.current.account_id}:${var.demo_monitoring_windows_iis_log_group}:*"]
  }

  statement {
    sid    = "KMSkeySSMParameter"
    effect = "Allow"
    actions = [
      "kms:Decrypt",
      "kms:*"
    ]
    resources = [aws_kms_key.demo_monitoring_kms_key.arn]
  }

}


data "aws_ami" "windows-server-2022" {
  most_recent = true
  owners      = ["amazon"]
  name_regex  = "Windows_Server-2022-English-Full-Base*"
}
ec2.tf – configuration of ec2 instance
#-------------------------------------------------------------------
# Demo Monitoring Server Configuration
#-------------------------------------------------------------------
module "demo_monitoring_server01" {
  source  = "terraform-aws-modules/ec2-instance/aws"
  version = "3.5.0"

  #checkov:skip=CKV_AWS_8: "Ensure all data stored in the Launch configuration or instance Elastic Blocks Store is securely encrypted"
  #checkov:skip=CKV_AWS_126: "Ensure that detailed monitoring is enabled for EC2 instances"
  #checkov:skip=CKV_AWS_79: "Ensure Instance Metadata Service Version 1 is not enabled"

  depends_on = [aws_ssm_parameter.cw_agent]

  name = "${var.app_name}-${var.environment}-01"

  ami                         = data.aws_ami.windows-server-2022.id
  instance_type               = "t3.medium"
  subnet_id                   = module.demo_monitoring_vpc.private_subnets[2]
  availability_zone           = module.demo_monitoring_vpc.azs[2]
  associate_public_ip_address = false
  vpc_security_group_ids      = [module.demo_server_sg.security_group_id]
  iam_instance_profile        = module.demo_monitoring_ec2_assumable_role.iam_instance_profile_id
  user_data_base64            = base64encode(local.user_data_prod)
  private_ip                  = var.demo_server_private_ip
  disable_api_termination     = false


  #  CKV_AWS_79: "Ensure Instance Metadata Service Version 1 is not enabled"
  metadata_options = {
    http_endpoint = "enabled"
    http_tokens   = "required"
  }


  enable_volume_tags = false
  root_block_device = [
    {
      volume_type = "gp3"
      volume_size = 80
      encrypted   = true
      kms_key_id  = aws_kms_key.demo_monitoring_kms_key.arn

      tags = {
        Name = "Demo-Monitoring-C-Drive"
      }
    },
  ]

  tags = merge(local.tags_generic)


}

resource "aws_ebs_volume" "demo_monitoring_d_drive" {

  size              = 30
  type              = "gp3"
  availability_zone = module.demo_monitoring_vpc.azs[2]
  encrypted         = true
  kms_key_id        = aws_kms_key.demo_monitoring_kms_key.arn

  tags = {
    Name = "Demo-Monitoring-D-Drive"
  }

}

resource "aws_volume_attachment" "demo_monitoring_d_drive_attachment" {

  device_name = "/dev/xvdf"
  volume_id   = aws_ebs_volume.demo_monitoring_d_drive.id
  instance_id = module.demo_monitoring_server01.id

}
iam.tf – configuration of IAM roles and policies
#------------------------------------------------------------------------------
# Unrestraint access for vpc flow log role to all logs - Check: CKV_AWS_111
#------------------------------------------------------------------------------
resource "aws_iam_policy" "vpc_flow_logging_boundary_role_policy" {
  name   = "vpc-flow-logging-boundary-policy"
  path   = "/"
  policy = data.aws_iam_policy_document.vpc_flow_logging_boundary_role_doc.json

  tags = local.tags_generic
}

#--------------------------------------------------------------------------
# SSM EC2  assumable role
#--------------------------------------------------------------------------
resource "random_id" "random_id" {
  byte_length = 5

}

module "demo_monitoring_ec2_assumable_role" {
  source  = "terraform-aws-modules/iam/aws//modules/iam-assumable-role"
  version = "4.17.1"

  trusted_role_services = [
    "ec2.amazonaws.com"
  ]

  role_requires_mfa       = false
  create_role             = true
  create_instance_profile = true

  role_name = "${var.app_name}-ec2-assumable-role-${random_id.random_id.hex}"

  custom_role_policy_arns = [
    "arn:aws:iam::aws:policy/AmazonSSMManagedInstanceCore",
    "arn:aws:iam::aws:policy/CloudWatchAgentServerPolicy" #required for cw agent
  ]

  tags = local.tags_generic
}

resource "aws_iam_policy" "demo_monitoring_ec2_assumable_policy" {
  name   = "${var.app_name}-ec2-assumable-role-policy"
  path   = "/"
  policy = data.aws_iam_policy_document.demo_monitoring_ec2_assumable_doc.json

  tags = local.tags_generic
}

resource "aws_iam_role_policy_attachment" "demo_monitoring_ec2_assumable_role_attachement" {
  role       = module.demo_monitoring_ec2_assumable_role.iam_role_name
  policy_arn = aws_iam_policy.demo_monitoring_ec2_assumable_policy.arn
}
kms.tf – configuration of kms key and policies
resource "aws_kms_key" "demo_monitoring_kms_key" {
  description         = "KMS Keys for Demo-Monitoring EBS Encryption"
  is_enabled          = true
  enable_key_rotation = true

  tags = merge(local.tags_generic)


  policy = <<EOF
{
    "Version": "2012-10-17",
    "Statement": [
        {
            "Sid": "Enable IAM User Permissions",
            "Effect": "Allow",
            "Principal": {
                "AWS": "arn:aws:iam::${data.aws_caller_identity.current.account_id}:root"
            },
            "Action": "kms:*",
            "Resource": "*"
        },
        {
            "Sid": "Allow cloudwatch to encrypt log groups with kms",
            "Effect": "Allow",
            "Principal": {
                "Service": "logs.${var.region}.amazonaws.com"
            },
            "Action": [
                "kms:Encrypt*",
                "kms:Decrypt*",
                "kms:ReEncrypt*",
                "kms:GenerateDataKey*",
                "kms:Describe*"
            ],
            "Resource": "*"
        },
        {
            "Sid": "Allow access for Key Administrators",
            "Effect": "Allow",
            "Principal": {
                "AWS": "arn:aws:iam::${data.aws_caller_identity.current.account_id}:root"
            },
            "Action": [
                "kms:Create*",
                "kms:Describe*",
                "kms:Enable*",
                "kms:List*",
                "kms:Put*",
                "kms:Update*",
                "kms:Revoke*",
                "kms:Disable*",
                "kms:Get*",
                "kms:Delete*",
                "kms:TagResource",
                "kms:UntagResource",
                "kms:ScheduleKeyDeletion",
                "kms:CancelKeyDeletion"
            ],
            "Resource": "*"
        },
        {
            "Sid": "Allow use of the key",
            "Effect": "Allow",
            "Principal": {
                 "AWS": [
                    "arn:aws:iam::${data.aws_caller_identity.current.account_id}:root"
                ]
            },
            "Action": [
                "kms:Encrypt",
                "kms:Decrypt",
                "kms:ReEncrypt*",
                "kms:GenerateDataKey*",
                "kms:DescribeKey"
            ],
            "Resource": "*"
        },
        {
            "Sid": "Allow attachment of persistent resources",
            "Effect": "Allow",
            "Principal": {
                "AWS": [
                    "arn:aws:iam::${data.aws_caller_identity.current.account_id}:root"
                ]
            },
            "Action": [
                "kms:CreateGrant",
                "kms:ListGrants",
                "kms:RevokeGrant"
            ],
            "Resource": "*",
            "Condition": {
                "Bool": {
                    "kms:GrantIsForAWSResource": "true"
                }
            }
        }
    ]
}
EOF
}

resource "aws_kms_alias" "demo_monitoring_kms_alias" {
  target_key_id = aws_kms_key.demo_monitoring_kms_key.key_id
  name          = "alias/${var.app_name}-${var.environment}"
}
locals.tf – user data and tagging schema
locals {
  region = "ap-southeast-2"

  tags_generic = {
    appname     = var.app_name
    environment = var.environment
    costcentre  = "TBC"
    ManagedBy   = var.ManagedByLocation
  }

  tags_ssm_ssm = {
    Name = "myvpc-vpce-interface-ssm-ssm"
  }

  tags_ssm_ssmmessages = {
    Name = "myvpc-vpce-interface-ssm-ssmmessages"
  }

  tags_ssm_ec2messages = {
    Name = "myvpc-vpce-interface-ssm-ec2messages"
  }


  user_data_prod = <<EOT
<powershell>
  Set-TimeZone -Name "New Zealand Standard Time"
  New-Item -Path "c:\temp" -Name "logfiles" -ItemType "directory"

  Install-WindowsFeature -name Web-Server -IncludeManagementTools
  Start-Sleep -Seconds 120
  New-Item -Path C:\inetpub\wwwroot\index.html -ItemType File -Value "Welcome to the Monitoring Demo IIS Webserver Home Page " -Force
  Set-Service -name W3SVC -startupType Automatic

  Invoke-WebRequest -Uri "http://localhost" -UseBasicParsing
  Invoke-WebRequest -Uri "http://localhost/fail" -UseBasicParsing

  # Get-Disk | Where partitionstyle -eq ‘raw’ | Initialize-Disk -PartitionStyle GPT -PassThru | New-Partition -AssignDriveLetter -UseMaximumSize | Format-Volume -FileSystem NTFS -NewFileSystemLabel “disk2” -Confirm:$false
  # Start-Sleep -Seconds 30

  ## CW Agent install
  c:
  cd \temp
  Invoke-WebRequest -Uri https://s3.amazonaws.com/amazoncloudwatch-agent/windows/amd64/latest/amazon-cloudwatch-agent.msi -OutFile c:\temp\amazon-cloudwatch-agent.msi
  & msiexec /i "c:\temp\amazon-cloudwatch-agent.msi" /l*v "cw_agent_install.log"
  Start-Sleep -Seconds 60
  & $env:ProgramFiles\Amazon\AmazonCloudWatchAgent\amazon-cloudwatch-agent-ctl.ps1 -a fetch-config -m ec2 -c ssm:/demo-monitoring/cloudwatch-agent/config -s

  Start-Sleep -Seconds 120

  # New-EventLog –LogName "Application" –Source “My Demo"
  # Write-EventLog –LogName "Application" –Source “My Demo" –EntryType "Error" –EventID 567 –Message “Test message for monitoring demo filter pattern.”

  # Invoke-WebRequest -Uri "http://localhost" -UseBasicParsing
  # Invoke-WebRequest -Uri "http://localhost/fail" -UseBasicParsing

</powershell>
  EOT

}
provider.tf – default Terraform file
provider "aws" {
  region = var.region

}
security-groups.tf – security group configuration for VPC endpoints and EC2 instance
#------------------------------------------------------------------------------
# Security Groups - SSM
#------------------------------------------------------------------------------
module "https_443_security_group" {
  source  = "terraform-aws-modules/security-group/aws//modules/https-443"
  version = "4.16.2"
  # Ignoring Checkov secret_name false positive detection
  #checkov:skip=CKV2_AWS_5: "Ensure that Security Groups are attached to another resource"

  name        = "https-443-sg"
  description = "Allow https 443"
  vpc_id      = module.demo_monitoring_vpc.vpc_id

  # Allow ingress rules to be accessed only within current VPC
  ingress_cidr_blocks = [module.demo_monitoring_vpc.vpc_cidr_block]

  # Allow all rules for all protocols
  egress_rules = ["https-443-tcp"]

  tags = local.tags_generic
}

#------------------------------------------------------------------------------
# Restrict default VPC Security Group - Check: CKV2_AWS_12
#------------------------------------------------------------------------------

resource "aws_default_security_group" "default" {
  depends_on = [module.demo_monitoring_vpc]

  vpc_id = module.demo_monitoring_vpc.vpc_id

  ingress = []
  egress  = []

  tags = local.tags_generic
}


module "demo_server_sg" {
  source  = "terraform-aws-modules/security-group/aws"
  version = "4.9.0"

  name        = "${var.environment}-${var.app_name}-sg"
  description = "Security group for ${var.environment} ${var.app_name} Server"
  vpc_id      = module.demo_monitoring_vpc.vpc_id

  ingress_cidr_blocks = ["0.0.0.0/0"]
  ingress_rules       = ["https-443-tcp"]

  ingress_with_cidr_blocks = [
    {
      from_port   = 3389
      to_port     = 3389
      protocol    = "tcp"
      description = "RDP accdess of VPC"
      cidr_blocks = var.vpc_cidr_range
    },

  ]
  egress_cidr_blocks = ["0.0.0.0/0"]
  egress_rules       = ["https-443-tcp", "http-80-tcp"]


  egress_with_cidr_blocks = [
    {
      rule        = "all-tcp"
      cidr_blocks = var.vpc_cidr_range
      description = "VPC Access"
    },
  ]

  tags = merge(local.tags_generic)
}
sns.tf – SNS topic configuration
module "demo_monitoring_sns_topic" {
  source  = "terraform-aws-modules/sns/aws"
  version = "3.3.0"

  name = "${var.app_name}-alerts"

  tags = merge(local.tags_generic)
}
ssm.tf – SSM endpoint configuration for remote access
#------------------------------------------------------------------------------
# VPC - SSM Endpoints
#------------------------------------------------------------------------------
module "vpc_ssm_endpoint" {

  source  = "terraform-aws-modules/vpc/aws//modules/vpc-endpoints"
  version = "3.13.0"

  vpc_id             = module.demo_monitoring_vpc.vpc_id
  security_group_ids = [module.https_443_security_group.security_group_id]

  endpoints = {
    ssm = {
      service             = "ssm"
      private_dns_enabled = true
      subnet_ids          = module.demo_monitoring_vpc.private_subnets
      tags                = merge(local.tags_generic, local.tags_ssm_ssm)
    },
    ssmmessages = {
      service             = "ssmmessages"
      private_dns_enabled = true,
      subnet_ids          = module.demo_monitoring_vpc.private_subnets
      tags                = merge(local.tags_generic, local.tags_ssm_ssmmessages)
    },
    ec2messages = {
      service             = "ec2messages",
      private_dns_enabled = true,
      subnet_ids          = module.demo_monitoring_vpc.private_subnets
      tags                = merge(local.tags_generic, local.tags_ssm_ec2messages)
    }
  }
}
ssm_parameter.tf – SSM parameter store configuration
resource "aws_ssm_parameter" "cw_agent" {
  description = "Cloudwatch agent config to configure Server metrics and alarms"
  name        = "/demo-monitoring/cloudwatch-agent/config"
  type        = "String"
  value       = file("app_cw_agent_config.json")

  #checkov:skip=CKV2_AWS_34: "AWS SSM Parameter should be Encrypted"

  tags = merge(local.tags_generic)
}
terraform.tfvars – default Terraform file with variable configuration settings
environment          = "test"
vpc_cidr_range       = "172.17.0.0/20"
private_subnets_list = ["172.17.0.0/24", "172.17.1.0/24", "172.17.2.0/24"]
public_subnets_list  = ["172.17.3.0/24", "172.17.4.0/24", "172.17.5.0/24"]
app_name             = "demo-monitoring"

#------------------------------------------------------------------------------
# EC2
#------------------------------------------------------------------------------

demo_server_private_ip = "172.17.2.34"

#------------------------------------------------------------------------------
#  Monitoring
#------------------------------------------------------------------------------

demo_monitoring_namespace                           = "demo-monitoring"
demo_monitoring_enabled                             = true
demo_monitoring_service_sploorer_alarm_enabled      = true
demo_monitoring_events_application_alarm_enabled    = true
demo_monitoring_log_iis_alarm_enabled               = true
demo_monitoring_cpu_utilization_threshold           = 80  # percent
demo_monitoring_disk_free_threshold                 = 10  # percent
demo_monitoring_memory_available_Mbytes_threshold   = 200 #32768*0.2
demo_monitoring_windows_iis_log_group               = "/demo-monitoring-iis-logs"
demo_monitoring_windows_event_application_log_group = "/demo-monitoring-application-logs"
variables.tf – default Terraform file
variable "region" {
  description = "AWS Region"
  default     = "ap-southeast-2"
  type        = string

}

variable "environment" {
  description = "AWS environment name"
  type        = string

}

variable "app_name" {
  description = "Applicaiton Name"
  type        = string

}

#------------------------------------------------------------------------------
# VPC
#------------------------------------------------------------------------------

variable "vpc_cidr_range" {
  type = string

}

variable "private_subnets_list" {
  description = "Private subnet list for infrastructure"
  type        = list(string)

}

variable "public_subnets_list" {
  description = "Public subnet list for infrastructure"
  type        = list(string)

}

#------------------------------------------------------------------------------
# Other
#------------------------------------------------------------------------------

variable "ManagedByLocation" {
  description = "IaC location"
  default     = "https://github.com/"
}


#------------------------------------------------------------------------------
#  EC2
#------------------------------------------------------------------------------

variable "demo_server_private_ip" {
  description = "Private IP address for Server"
  type        = string

}

#------------------------------------------------------------------------------
#  Monitoring
#------------------------------------------------------------------------------

variable "demo_monitoring_namespace" {
  description = "Name space for metrics and alerts"
  type        = string
}

variable "demo_monitoring_enabled" {
  description = "Switch to tunrn on/off monitoring"
  type        = bool
}


variable "demo_monitoring_service_sploorer_alarm_enabled" {
  description = "Switch to tunrn on/off element monitoring"
  type        = bool
}

variable "demo_monitoring_events_application_alarm_enabled" {
  description = "Switch to tunrn on/off windows application event log monitoring"
  type        = bool
}

variable "demo_monitoring_log_iis_alarm_enabled" {
  description = "Switch to tunrn on/off windows iis file log monitoring"
  type        = bool
}


variable "demo_monitoring_cpu_utilization_threshold" {
  description = "Maximum % CPU level before cloudwatch alarm trigger"
  type        = number
}

variable "demo_monitoring_disk_free_threshold" {
  description = "Maximum % free disk level before cloudwatch alarm trigger"
  type        = number
  default     = 90
}


variable "demo_monitoring_memory_available_Mbytes_threshold" {
  description = "Maximum % Memory level before cloudwatch alarm trigger"
  type        = number
  default     = 80
}


variable "demo_monitoring_windows_iis_log_group" {
  description = "Log group name in AWS for Windows EC2 IIS log file data"
  type        = string
}

variable "demo_monitoring_windows_event_application_log_group" {
  description = "Log group name in AWS for Windows EC2 Application log captured events"
  type        = string
}
vpc.tf – VPC configuration with NAT gateway, Internet gateway, Subnets etc
#------------------------------------------------------------------------------
# VPC Module
#------------------------------------------------------------------------------
module "demo_monitoring_vpc" {
  source  = "terraform-aws-modules/vpc/aws"
  version = "3.18.1"
  # Ignoring Checkov mitigation via boundary rule added, checkov unable logging enabled in module
  #checkov:skip=CKV_AWS_111: "Ensure IAM policies does not allow write access without constraints"
  #checkov:skip=CKV2_AWS_11: "Ensure VPC flow logging is enabled in all VPCs"
  #checkov:skip=CKV2_AWS_19: "Ensure that all EIP addresses allocated to a VPC are attached to EC2 instances"
  #checkov:skip=CKV2_AWS_12: "Ensure the default security group of every VPC restricts all traffic"
  #checkov:skip=CKV_AWS_130: "Ensure VPC subnets do not assign public IP by default"

  name = "${var.app_name}-${var.environment}-vpc"
  cidr = var.vpc_cidr_range

  azs             = ["${var.region}a", "${var.region}b", "${var.region}c"]
  private_subnets = var.private_subnets_list
  public_subnets  = var.public_subnets_list


  enable_flow_log                      = true
  create_flow_log_cloudwatch_log_group = true
  create_flow_log_cloudwatch_iam_role  = true
  vpc_flow_log_permissions_boundary    = aws_iam_policy.vpc_flow_logging_boundary_role_policy.arn
  flow_log_max_aggregation_interval    = 60

  create_igw         = true
  enable_nat_gateway = true
  enable_ipv6        = false

  enable_dns_hostnames = true
  enable_dns_support   = true

  tags = local.tags_generic

}
After you deploy the code, you will need to wait about 10 minutes for the Cloudwatch agent to be configured at the OS level and start sending data to AWS. There are a couple of commands we need to get alerts working.
I will end the post here and continue with a new post (part 2) here.

[…] is a continuation from part1 in this series on AWS Windows EC2 Instance monitoring. If you have not already deployed the code […]
LikeLike