

Amazon Lambda is a serverless compute service provided by Amazon Web Services (AWS) that enables users to run code without provisioning or managing servers. The code can be written in several languages such as Python, Node.js, Java, C#, Go, allowing users to build diverse applications that can scale on demand horizontally. The great thing about Lambda Functions is that you only pay for what you use and idle resources are not charged for. This feature makes it a great choice for building cost-efficient services. Unfortunately one of the downsides of being a serverless solution is that it can be tricky to monitor Lambda Functions. In this blog I will demonstrate how to monitor Lambda Functions using CloudWatch.
We had a situation where we were providing services to a customer but needed to get some information from the customer’s API to enrich the data that we presented back to them. We would query the customer’s API hourly with a Lambda Function. When the customer’s API broke, they complained that our service was broken (they did not notice their own systems were down). Our services were fine, but we had a dependency on one of the customer’s subsystems so it appeared that our services were not operating correctly. As a result, we implemented some CloudWatch alarms to notify us when our Lambda Function returned an error when querying the customer’s API.
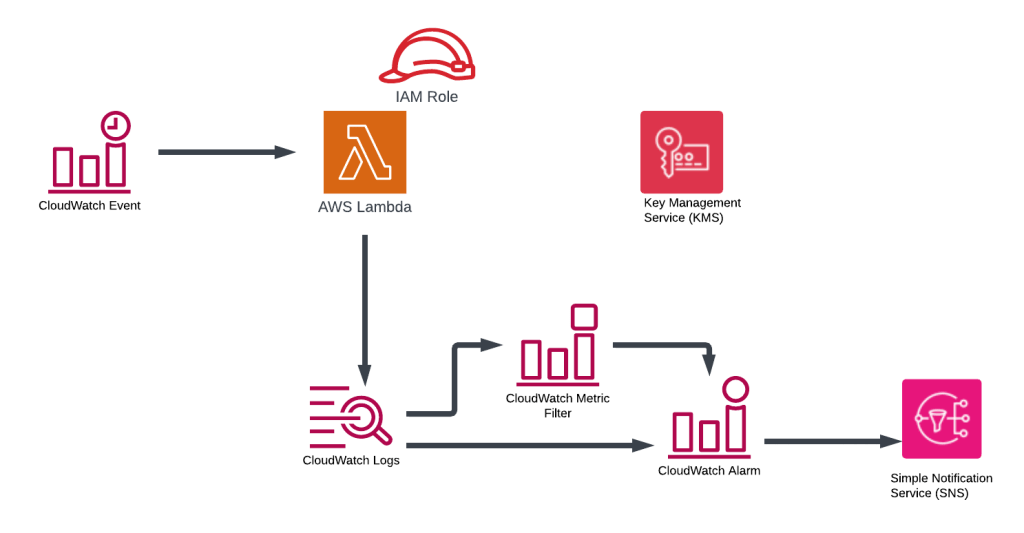
This blog demonstrates how to create the following infrastructure to simulate the Lambda Function that occasionally fails and monitor the Lambda Function.
The Terraform code that deploys the infrastructure can be found here (https://github.com/arinzl/aws-lambda-monitoring).
The main components of the solution are:
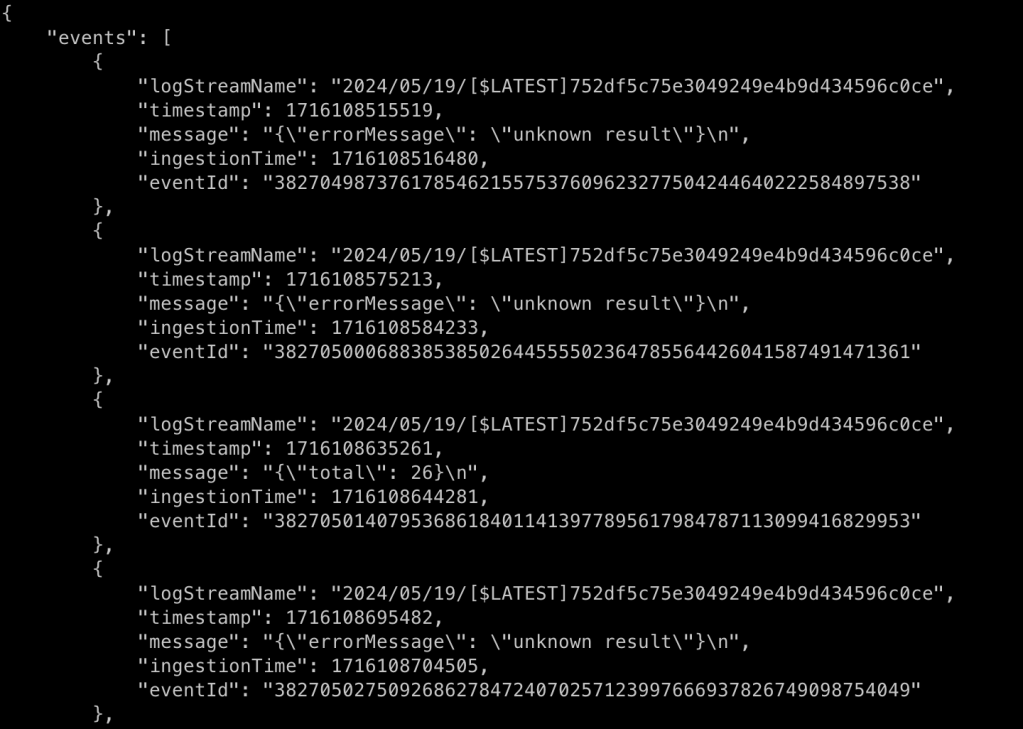
Lambda Function: Generates two random numbers and adds them together. If the sum of the generated random numbers is even, it will create an entry in a Cloudwatch Log Group with the result displaying in JSON format eg ‘{“total” : 26}’. If the sum of the generated random numbers is odd, it will create an entry in a Cloudwatch Log Group with a JSON formatted error message eg ‘{“errorMessage” : “unknown result”}’.
resource "aresource "aws_lambda_function" "myapp_lambda_function" {
  filename      = "${path.module}/appfolder_out/myapp.zip"
  function_name = var.app_name
  role          = aws_iam_role.lambda.arn
  handler       = "myapp.lambda_handler"
  runtime       = "python3.12"
}
import random
import json
import sys

def lambda_handler(event, context):
    RandomNum1 = random.randint(1, 10)
    RandomNum2 = random.randint(1, 50)

    total = RandomNum1 + RandomNum2

    # Business logic - if the total is even (no error and print total) or odd (an error and print errorMessage)
    if total % 2 == 0:
        result = {"total": total}
    else:
        result = {"errorMessage": "unknown result"}

    result_json = json.dumps(result)

    # Write only the JSON formated result to cloudwatch so we can easily search for it
    sys.stdout.write(result_json + '\n')

    return total
Cloudwatch Event: schedules the lambda function to run every minute
resource "aws_cloudwatch_event_rule" "demo_app_schedule" {
  name                = "demo-app-schedule"
  description         = "Schedule for demo app"
  schedule_expression = "cron(* * * * ? *)"
}

resource "aws_cloudwatch_event_target" "demo_apps_trigger" {
  arn  = aws_lambda_function.myapp_lambda_function.arn
  rule = aws_cloudwatch_event_rule.demo_app_schedule.name
}

resource "aws_lambda_permission" "demo_app_trigger_permission" {
  statement_id  = "AllowCWEventTrigger"
  action        = "lambda:InvokeFunction"
  function_name = aws_lambda_function.myapp_lambda_function.function_name
  principal     = "events.amazonaws.com"
  source_arn    = aws_cloudwatch_event_rule.demo_app_schedule.arn
}
Cloudwatch Metrics & Alarms: provides functionality to monitor AWS resources via metrics calculations (eg sum, max, min etc within a period) and produces a datapoint. When a datapoint(s) exceeds a threshold, the alarm state is updated. The change of state can be assigned an action, in our case we send an alarm message to a SNS topic.
#------------------------------------------------------------------------------
# Cloudwatch Loggroup
#------------------------------------------------------------------------------

resource "aws_cloudwatch_log_group" "demo_app" {
  depends_on = [aws_kms_key.kms_key_demo_app]

  name              = "/aws/lambda/${var.app_name}"
  retention_in_days = 7
  kms_key_id        = "arn:aws:kms:${var.region}:${data.aws_caller_identity.current.account_id}:alias/${var.app_name}"

}

#------------------------------------------------------------------------------
# Cloudwatch Metric filters
#------------------------------------------------------------------------------

resource "aws_cloudwatch_log_metric_filter" "lambda_error_messages" {
  name           = "errorMessages-lambda"
  pattern        = "{$.errorMessage = \"*result*\"}"
  log_group_name = aws_cloudwatch_log_group.demo_app.name

  metric_transformation {
    name      = "errorMessage-lambda-count"
    namespace = "myapp-namespace"
    value     = 1
  }
}

resource "aws_cloudwatch_log_metric_filter" "lambda_result" {
  name           = "lambda-result"
  pattern        = "{$.total = \"*\"}"
  log_group_name = aws_cloudwatch_log_group.demo_app.name

  metric_transformation {
    name      = "lambda-result-vallue"
    namespace = "myapp-namespace"
    value     = "$.total"
  }
}

#------------------------------------------------------------------------------
# Cloudwatch Metric Alarm
#------------------------------------------------------------------------------

resource "aws_cloudwatch_metric_alarm" "lambda_error_messages" {
  alarm_name          = "monitoring-lambda-error_messages"
  comparison_operator = "GreaterThanOrEqualToThreshold"
  evaluation_periods  = "3"
  metric_name         = aws_cloudwatch_log_metric_filter.lambda_error_messages.metric_transformation[0].name
  namespace           = aws_cloudwatch_log_metric_filter.lambda_error_messages.metric_transformation[0].namespace
  period              = "120"
  statistic           = "Sum"
  threshold           = 1
  datapoints_to_alarm = 2
  treat_missing_data  = "notBreaching"

  alarm_description = "Lambda error messages count - 2 datapoints within 6 minutes (3 periods)"

  alarm_actions = [aws_sns_topic.lambda_monitoring.arn]
  ok_actions    = [aws_sns_topic.lambda_monitoring.arn]
}


resource "aws_cloudwatch_metric_alarm" "lambda_results" {
  alarm_name          = "monitoring-lambda-results"
  comparison_operator = "GreaterThanOrEqualToThreshold"
  evaluation_periods  = "2"
  metric_name         = aws_cloudwatch_log_metric_filter.lambda_result.metric_transformation[0].name
  namespace           = aws_cloudwatch_log_metric_filter.lambda_result.metric_transformation[0].namespace
  period              = "120"
  statistic           = "Average"
  threshold           = 32
  datapoints_to_alarm = 2
  treat_missing_data  = "breaching"

  alarm_description = "Lambda results"

  alarm_actions = [aws_sns_topic.lambda_monitoring.arn]
  ok_actions    = [aws_sns_topic.lambda_monitoring.arn]
}
SNS Topic: Users can subscribe to the SNS topic to be notified of the state change. A policy allows Cloudwatch to publish messages to the SNS topic.
Resource "aws_sns_topic" "lambda_monitoring" {
  depends_on = [aws_kms_key.kms_key_demo_app]

  name              = "lambda-monitoring"
  kms_master_key_id = "arn:aws:kms:${var.region}:${data.aws_caller_identity.current.account_id}:alias/${var.app_name}"
}

resource "aws_sns_topic_policy" "lambda_monitoring_policy" {
  arn    = aws_sns_topic.lambda_monitoring.arn
  policy = data.aws_iam_policy_document.lambda_monitoring_policy_document.json
}

data "aws_iam_policy_document" "lambda_monitoring_policy_document" {
  statement {
    sid    = "CloudwatchAccess"
    effect = "Allow"
    actions = [
      "SNS:Publish",
    ]
    resources = [
      aws_sns_topic.lambda_monitoring.arn
    ]

    principals {
      type        = "Service"
      identifiers = ["cloudwatch.amazonaws.com"]
    }
  }

  statement {
    sid    = "DefaultAccountAccess"
    effect = "Allow"
    actions = [
      "SNS:GetTopicAttributes",
      "SNS:SetTopicAttributes",
      "SNS:AddPermission",
      "SNS:RemovePermission",
      "SNS:DeleteTopic",
      "SNS:Subscribe",
      "SNS:ListSubscriptionsByTopic",
      "SNS:Publish"
    ]
    resources = [
      aws_sns_topic.lambda_monitoring.arn
    ]

    condition {
      test     = "StringEquals"
      values   = [data.aws_caller_identity.current.account_id]
      variable = "AWS:SourceOwner"
    }

    principals {
      type        = "AWS"
      identifiers = ["*"]
    }
  }
}
IAM role: Lambda Function runs as an IAM role, which has a trust policy allowing usage by Lambda. The policy grants permissions to Cloudwatch Loggroups.
resource "aws_iam_role" "lambda" {
  name = "${var.app_name}-lambda-role"

  assume_role_policy = <<-EOF
    {
        "Version": "2012-10-17",
        "Statement": [
            {
                "Principal": {
                    "Service": "lambda.amazonaws.com"
                },
                "Action": "sts:AssumeRole",
                "Effect": "Allow"
            }
        ]
    }
    EOF
}


resource "aws_iam_role_policy" "lambda_role_policy" {
  name = "${var.app_name}-lambda-policy"
  role = aws_iam_role.lambda.id

  policy = <<-EOF
    {
      "Version": "2012-10-17",
      "Statement": [
          {
              "Sid": "LambdaCloudwatchGroup",
              "Effect": "Allow",
              "Action": "logs:CreateLogGroup",
              "Resource": "arn:aws:logs:*:${data.aws_caller_identity.current.account_id}:*"
          },
          {
              "Sid": "LambdaCloudwatchLogging",
              "Effect": "Allow",
              "Action": [
                  "logs:CreateLogStream",
                  "logs:PutLogEvents"
              ],
              "Resource": "arn:aws:logs:*:${data.aws_caller_identity.current.account_id}:log-group:/aws/lambda/${var.app_name}:*"
          }
      ]
    }
    EOF
}
For good practice, we will create a KMS key and implement an encrypted Log Group for the Lambda Function outputs. This CloudWatch Log Group will have a log retention period applied. The SNS topic will be encrypted with the same KMS key. The KMS key details are shown below.
resource "aws_kms_key" "kms_key_demo_app" {
  description = "KMS for SNS topic and cloudwatch logs"
  policy      = data.aws_iam_policy_document.kms_policy_demo_app.json

  enable_key_rotation = true
}

resource "aws_kms_alias" "kms_alias_demo_appc" {
  name          = "alias/${var.app_name}"
  target_key_id = aws_kms_key.kms_key_demo_app.id
}

data "aws_iam_policy_document" "kms_policy_demo_app" {

  statement {
    sid    = "Enable IAM User Permissions"
    effect = "Allow"
    principals {
      type        = "AWS"
      identifiers = ["arn:aws:iam::${data.aws_caller_identity.current.account_id}:root"]
    }
    actions = [
      "kms:*"
    ]
    resources = [
      "arn:aws:kms:${var.region}:${data.aws_caller_identity.current.account_id}:key/*"
    ]
  }
  statement {
    sid    = "Allow key usage for SNS topics"
    effect = "Allow"
    principals {
      type = "Service"
      identifiers = [
        "sns.amazonaws.com"
      ]
    }
    actions = [
      "kms:Encrypt",
      "kms:Decrypt",
      "kms:ReEncrypt*",
      "kms:GenerateDataKey*",
      "kms:DescribeKey",
    ]
    resources = [
      "*"
    ]
    condition {
      test     = "ArnEquals"
      variable = "kms:EncryptionContext:aws:sns:arn"

      values = ["arn:aws:sns:${var.region}:${data.aws_caller_identity.current.account_id}:*"]

    }
  }

  statement {
    sid    = "Allow CloudWatch Alarms Access to SNS topics"
    effect = "Allow"
    principals {
      type = "Service"
      identifiers = [
        "cloudwatch.amazonaws.com"
      ]
    }
    actions = [
      "kms:Decrypt",
      "kms:GenerateDataKey*"
    ]
    resources = [
      "*"
    ]
    condition {
      test     = "StringEquals"
      variable = "kms:ViaService"
      values   = ["sns.ap-southeast-2.amazonaws.com"]
    }
  }

  statement {
    sid    = "Allow cross account key usage for CloudWatch Logs"
    effect = "Allow"
    principals {
      type = "Service"
      identifiers = [
        "logs.${var.region}.amazonaws.com"
      ]
    }
    actions = [
      "kms:Encrypt",
      "kms:Decrypt",
      "kms:ReEncrypt*",
      "kms:GenerateDataKey*",
      "kms:DescribeKey",
    ]
    resources = [
      "*"
    ]
    condition {
      test     = "ArnEquals"
      variable = "kms:EncryptionContext:aws:logs:arn"

      values = ["arn:aws:logs:${var.region}:${data.aws_caller_identity.current.account_id}:log-group:*"]

    }
  }
}
If you have successfully deployed the Terraform code from the GitHub Repo and subscribed to SNS topic, you may have received a few SNS alert messages.
Run the following AWS CLI command to observe the outputs from the Lambda Function or use the console.
aws logs filter-log-events --log-group-name /aws/lambda/demo-app --filter-pattern "{($.errorMessage = \"*result*\") || ($.total = \"*\")}" --limit 20 --region ap-southeast-2
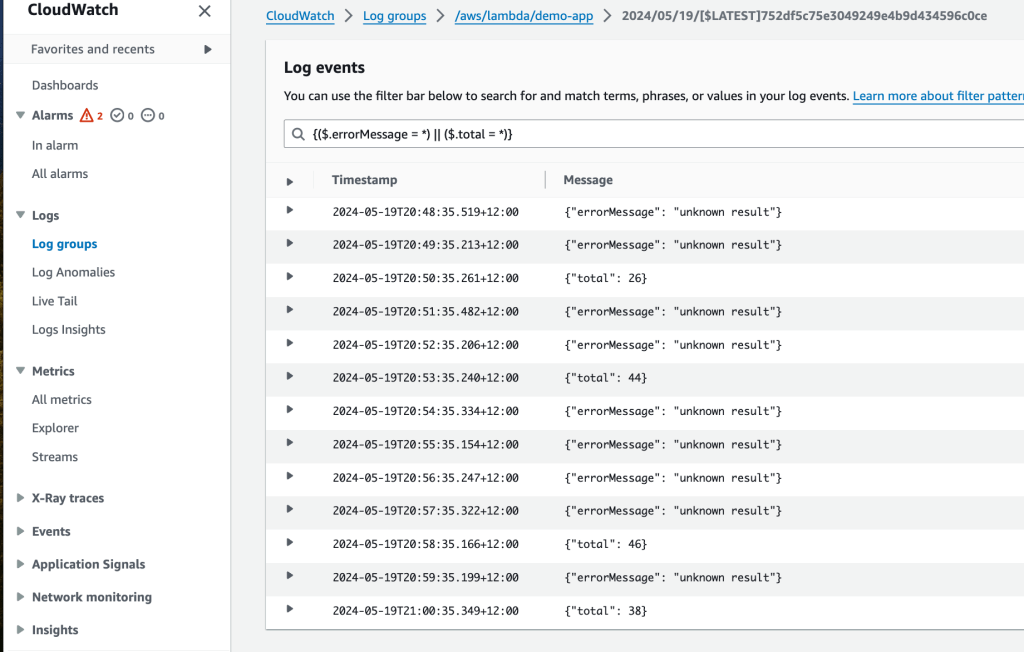
Otherwise, add a filter to the Cloudwatch console such as ‘{($.errorMessage = *) || ($.total = *)}’ to observe the outputs from the Lambda Function as shown below.
If you have subscribed to SNS Topic you will eventually get some alerts (see below for example).
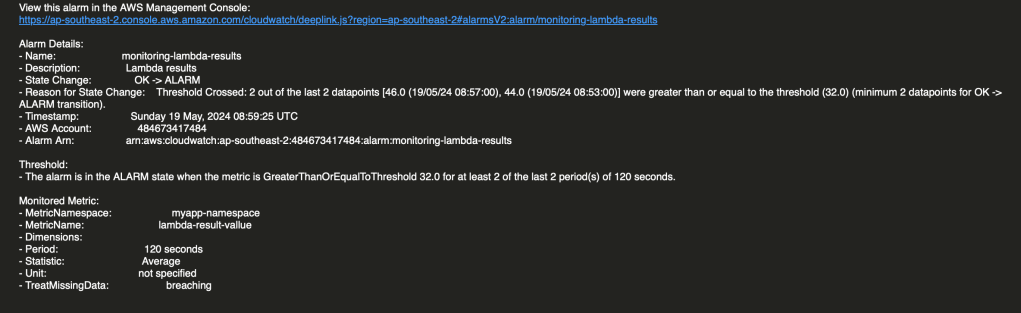
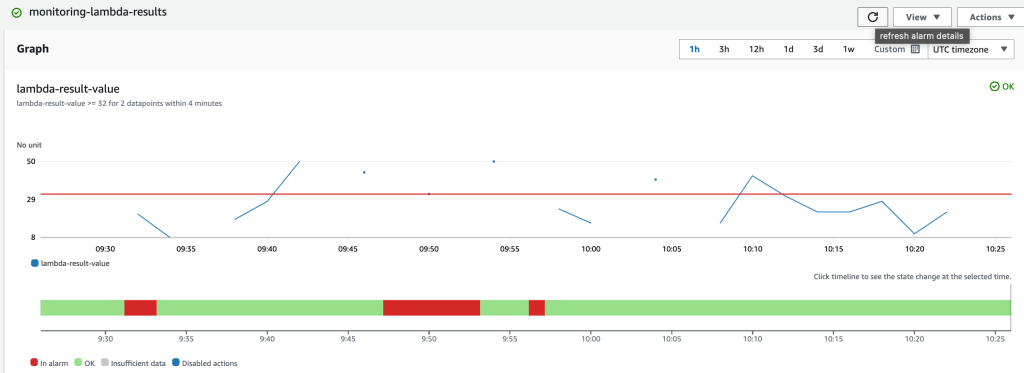
The metric-filter based alarm state is likely to fluctuate over time (see diagram below) and generate notifications.
Hopefully, this tutorial has given you some insights into Amazon Lambda Function monitoring. Lamba Function monitoring was achieved by creating meaningful log entries from the Lambda function execution into a Cloudwatch Log Group. We were able to read the CloudWatch text based log entries and convert them into measurable metrics using a metric filter. Using these metrics, we calculated a datapoint for a given period. If the number of datapoints exceeded the threshold for a certain number of periods, then an alert was sent to an SNS topic.
