

This is a continuation from part1 in this series on AWS Windows EC2 Instance monitoring. If you have not already deployed the code from the GitHub repository (https://github.com/arinzl/aws-monitoring-ec2-windows-part1) please do so now. It will take about 8-10 minutes before entries appear in log groups “/demo-monitoring-iis-logs” and “/demo-monitoring-application-logs” which will confirm everythings looks good so far.
The code will deploy 5 metric Cloudwatch Alarms:
- Operating System CPU utilisation (percent)
- Operating System Memory free (Mbytes)
- Operating System C Drive free space (percentage)
- Operating System D Drive free space (percentage)
- Operating System spooler service (state)
The alert thresholds are set in the terraform.tfvars file and can be easily manipulated and redeployed quickly if required. The CPU alert is a standard alert and will alert if the instance’s CPU utilisation raises above 80% for three minutes.
The memory utilisation is a bit more tricky, as there is no Perfmon counter for memory utilisation. A t3.medium EC2 instance has 2 vCPU with 4GB of RAM. If we want to alert when the memory utilisation exceeds 85%, this is equivalent to alerting when there is less than 15% available memory. For t3.medium this would be 614.4 Mbytes available (0.15*4GB*1024).
The C & D drive free space alerts will alert if the drives have less then 10% free space. You may have noticed that the D drive free space alert is in the ‘Alarm’ state as it has not received any data yet. This is because the EC2 user data did not initialise a D drive on the operating system. We will need to remotely access our EC2 instance and run a powershell command to configure the D drive.
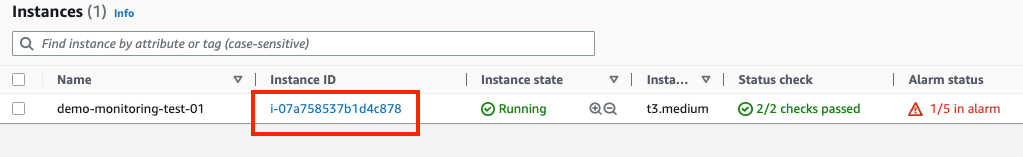
To access the EC2 instance remotely via SSM, open the EC2 service page and find your instance, and click on the hyperlink to your instance details.
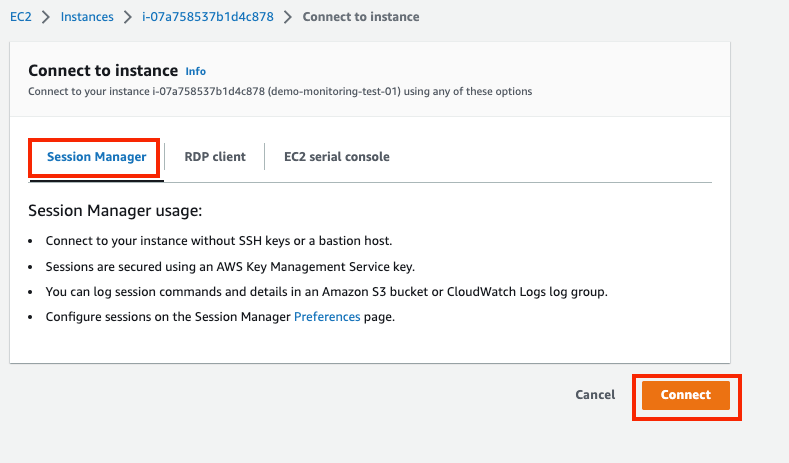
Click the ‘Connect’ button in the upper right hand side of your screen.

Ensure ‘Session Manager’ is selected and click the ‘Connect’ button.
This will open up an administrative powershell prompt on the EC2 instance. To initialise the second drive and assign it drive letter ‘D’, run the following powershell command:
Get-Disk | Where partitionstyle -eq ‘raw’ | Initialize-Disk -PartitionStyle GPT -PassThru | New-Partition -AssignDriveLetter -UseMaximumSize | Format-Volume -FileSystem NTFS -NewFileSystemLabel “disk2” -Confirm:$false
When applications are installed on a Windows Operating System it is common for the installer to setup a service that runs continuously. This service can be stopped and started when required. To list the services running on a Windows Server, run the following command to produce a list of services.
Get-Service
In the output from the above command, the first column is the service state, the second column is the service name and the final output column is the display name. On closer inspection of the app_cw_agent_config.json file, we need to find the name of the executable file that spawns the service. To get the executable name run the following powershell command from your server:
Get-WmiObject win32_service | select Name, DisplayName, State, PathName
For our example, the spooler service is spawned from executable spoolsv.exe. To monitor service, we gather the ‘memory_rss’ data for our executable file. The value of ‘memory_rss’ represents the amount of real memory that the process is using. We can stop the service via the command:
Stop-Service -Name spooler
As the service is stopped there is no new data in the ‘memory_rss’ Cloudwatch dimension and the absence of data will trigger an alert after 3-4 minutes. Once you receive the alert start the spooler service again with command ‘Start-Service -Name spooler’.
If you want to generate the CPU and memory alerts by stressing the operating system, you can use tools from the Microsoft System Internals toolkit such as cpustres or testlimit to simulate high CPU and memory usage.
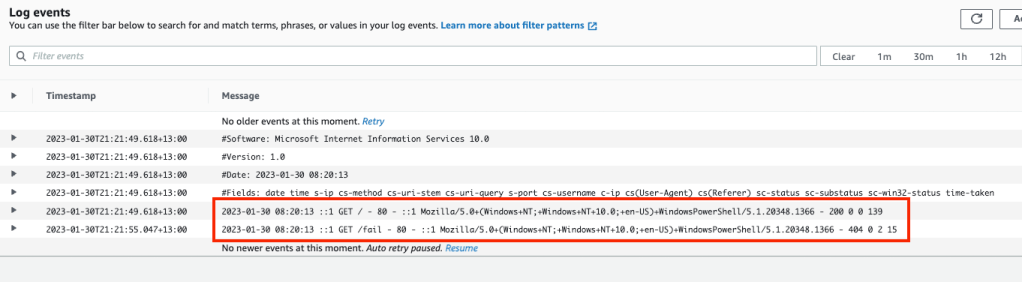
The last two elements of Windows server monitoring discussed in this blog are the file monitoring and Windows event monitoring. Both these are in the category “Logs” in the monitoring configuration file. The configuration supplied in the code repository results in log stream data within the Cloudwatch log groups. For file monitoring, we effectively sync IIS logs into the log group ‘/demo-monitoring-iis-logs‘. To push records into this log group stream run the following powershell commands from the EC2 instance:
Invoke-WebRequest -Uri "http://localhost" -UseBasicParsing
Invoke-WebRequest -Uri "http://localhost/fail" -UseBasicParsing
You should see a couple of entries in the ‘/demo-monitoring-iis-logs‘ log group under the instance id.
Eventlog monitoring works on the same basis as file log sync. However, the cloudwatch agent translate the Windows XML event log message into plain text with keys which are surrounded by square brackets eg [ ]. The message in Cloudwatch includes keys for Event log type; Severity; EventID & message text (plus some additional keys). How do you turn textural content in these fields into something we can monitor using Cloudwatch Alarm? We use Metric Filters to search for text patterns we are interested in, and count the number occurence of that pattern. Windows applications emit messages into the Windows Event logs to provide telemetry on how the application is behaving. In the IIS log we could have counted the number of 404 http messages within a minute and if there are too many 404 entries it can indicate something is going wrong on the server or that there are potentially malicious activity occurring. For example if we wanted to count the number of messages with severity ERROR, event id of 567 and message contained keyword Demo, we would create a Metric filter with a pattern of:
"[ERROR]" "[567]" Demo
If this pattern was detected three of more times in a minute, it would generate an alert.
Connect to your EC2 instance and run the following Powershell commands to generate an alert in Cloudwatch.
New-EventLog –LogName "Application" –Source “My Demo"
Write-EventLog –LogName "Application" –Source “My Demo" –EntryType "Error" –EventID 567 –Message “Test message for monitoring demo filter pattern.”
Write-EventLog –LogName "Application" –Source “My Demo" –EntryType "Error" –EventID 567 –Message “Test message for monitoring demo filter pattern.”
Write-EventLog –LogName "Application" –Source “My Demo" –EntryType "Error" –EventID 567 –Message “Test message for monitoring demo filter pattern.”
Write-EventLog –LogName "Application" –Source “My Demo" –EntryType "Error" –EventID 567 –Message “Test message for monitoring demo filter pattern.”
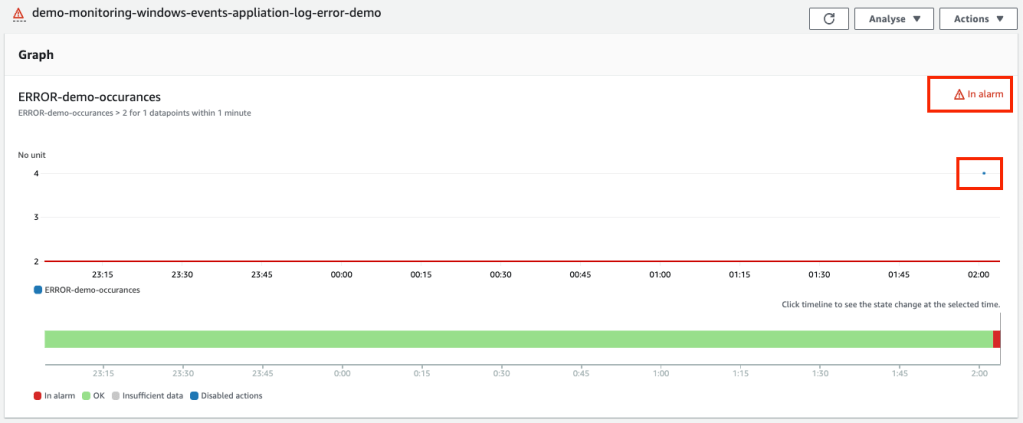
Check that entries appear in ‘/demo-monitoring-application-logs‘ log group

Eventually the alert will be triggered.
Hopefully these two blog posts have improved your understanding of Windows EC2 Instance monitoring in AWS. Lastly it is worth noting that we are able to monitor on premise Windows Servers using the Cloudwatch agent in a similar manner.

[…] I will end the post here and continue with a new post (part 2) here. […]
LikeLike